The Stink
Eleven seasons. 4,147 Premier League matches. What the data says about set pieces, and what it doesn't.
Set Pieces · Corners · Goals · 2015/16 to 2025/26

It is the summer of 1858. The Thames is a festering sore. Two and a half million Londoners flush their waste into the same river that fills their drinking cups. Parliament sits on its banks. The curtains of the Palace of Westminster are soaked in chloride of lime, corrosive to skin, eyes, and lungs, but doing nothing is less palatable. In any event, it solves nothing. Members gag in the chamber. Select committees break up mid-session. The press names it the Great Stink.
The stink is not the news, but the stink is all anyone can talk about.
Four hundred miles north and a hundred and sixty-seven years later, a different crowd has its own theory about the air.
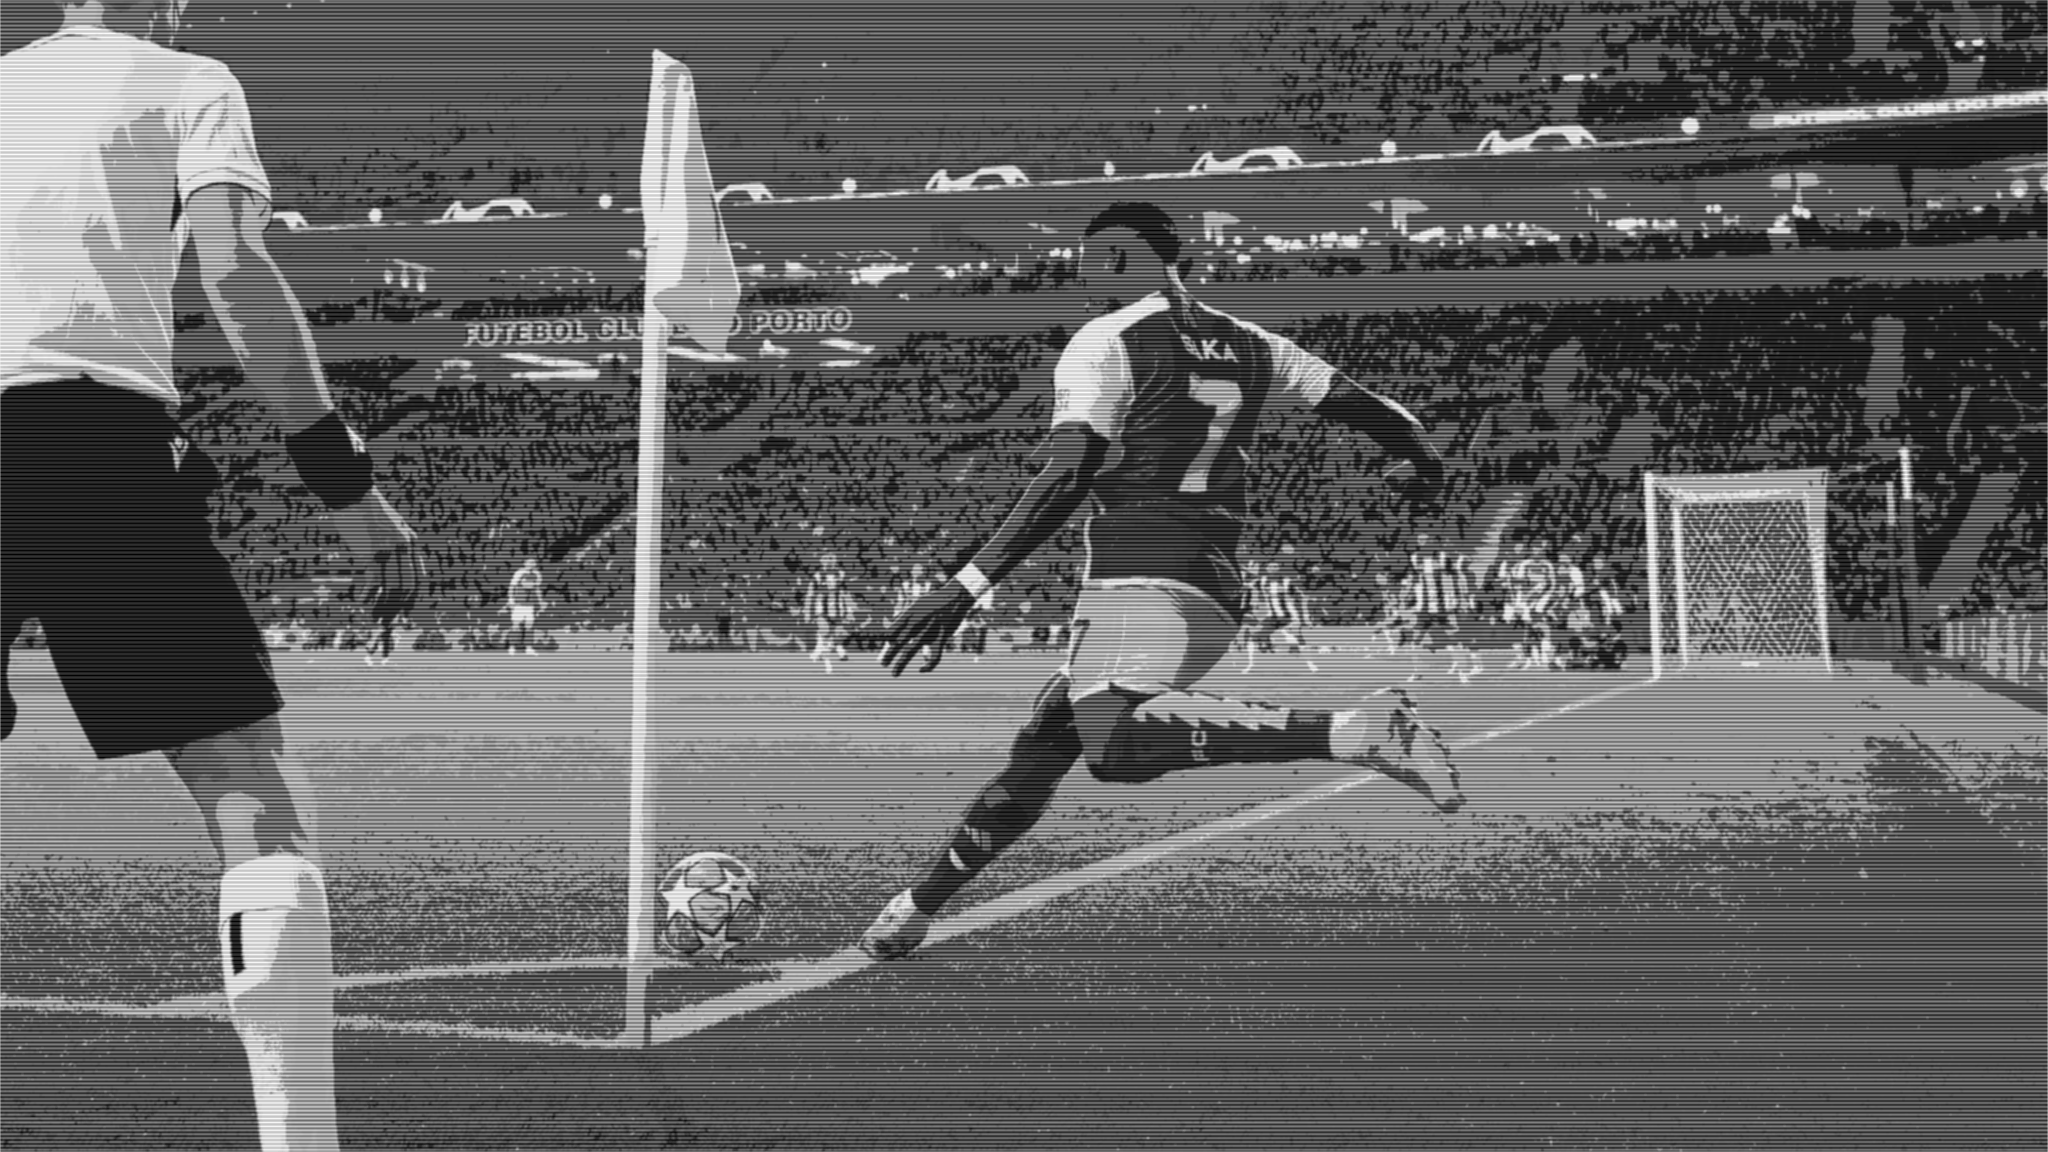
The Leazes End looms over the pitch. It's the 96th minute at St James' Park. 28 September 2025. Martin Odegaard places the ball for a corner on the right. Four Arsenal players cluster around the six-yard box. One waits in the penalty area. Four hold positions outside. The inswinger leaves his foot and the formation breaks: one man crowds Nick Pope on his line. Four runners attack the near post. A fifth peels wide to the far side. Pope cannot move. Gabriel Magalhães, attacking the near-post, meets the delivery and nods it in. Pope never had a chance. The pundits will tell you why: the Premier League, they announce in the studio and on the radio and in breakdowns thereafter, is on the brink of a set piece revolution.
Everyone can smell it.
Dead balls account for 27.2% of goals scored so far this season, the highest share in the 11 seasons of event-level data we have looked at. Open play, which once produced nearly 70% of goals, has fallen below 57%. Conversations now touch on how little the ball is in play, whether the ever-growing fixture schedule is to blame, or if the recent managerial love-in for tall, physical players is a key driver.
This is a story about set pieces. It is also a story about miasma, sewer engineering, and the difference between smelling the problem and understanding it.
The folk explanation
Before John Snow traced cholera to a water pump on Broad Street, the prevailing wisdom of medical minds of the time was that disease spread through miasma (foul air rising from rotting matter). Like the concept of humours before it, the theory was intuitive. Cholera outbreaks aligned nicely with bad smells. Neighbourhoods that stank were neighbourhoods that died. Sensible. Obvious even. Also completely wrong.
Football, is deeply intuitive, but also has a penchant for scratching the surface. This is perfectly fine, as is swearing by the eye test. But of late, football has surfaced its own miasma theory, its vapours being impossible to ignore. When pundits explain the set piece revolution, the first suspect is always height. Set piece aerial duels lead to goals. Bigger teams win more aerial duels. Therefore teams are getting bigger to win games from set pieces. It stinks of common sense.
Where goals come from
Goal source breakdown across eleven seasons. Dead ball share hits its highest point. Open play falls below 57% for the first time.
The structural break
For eight years, set-piece shot share barely moved, then it jumps this season. League-wide set-piece shot share (intent), set-piece goal share (outcome), and corner conversion (execution). 2017/18 to 2025/26. This season, 15 of 20 teams score at least 25% of their goals from dead balls.
The exception
Structural breaks do not lift every boat. Manchester City once had the cleanest set-piece “plumbing” in the league: an attacking system that kept producing chances even when coaches moved on. Now the infrastructure is eroded. Their set-piece edge shrinks from a peak of +18 net set-piece goals to negative.
| Season | Goals | SP Goals | SP G% | Conceded | SP Conc | Net SP |
|---|---|---|---|---|---|---|
| 2017/18 | 105 | 16 | 15.2% | 28 | 3 | +13 |
| 2021/22 | 96 | 20 | 20.8% | 29 | 2 | +18 |
| 2024/25 | 73 | 8 | 11% | 43 | 5 | +3 |
| 2025/26 | 53 | 6 | 11.3% | 28 | 8 | -2 |
The decline is not a football story. It is a plumbing story. Jover arrived in summer 2019; the pipes began to flow. He left in summer 2021. For two seasons the residual system held. 2021/22 produced City's best dead-ball return in the data, +18 net goals. Then the infrastructure was never rebuilt. By 2025/26 the net is negative. The engineer left. Nobody replaced him.
Toggle to shots and you can see why the “set piece league” line caught fire. For eight seasons, set-piece intent hovered in the high twenties. This year it breaks past thirty. At the same time, corner conversion sits at 11.2%, after eight seasons between 8.3% and 9.5%. Toggle back to goals and the effect compounds: conversion rises, then everything looks like a revolution. The key point is breadth: it is no longer a handful of freak seasons or specialist clubs. This year, 15 of 20 teams are getting a quarter of their goals from dead balls. It isn't only volume, but for the first time in the data, volume and conversion shift together. Even now, the Big Six as a group take a smaller share of set-piece shots than the league as a whole ( 24.9% vs 30.6%).
Liverpool field the tallest starting XI in the Premier League. An average of 186.2 centimetres. They convert headers at 4.3%, the worst rate in the division. Chelsea, the fifteenth-tallest squad, convert at 17.9%, the best. Brentford attempt more headers per match than any club in the league and convert fewer than one in ten. The miasma does not hold.
The chart below ranks every squad by height on the left and by header conversion on the right. If height explained heading, these lines would run parallel. They do not. They cross, tangle, contradict. The folk explanation does not survive contact with the data.
The miasma theory
If height determined heading ability, these lines would run parallel. They don't.
The pipes
Snow did not fix cholera by making London smell better. He mapped where people were dying and traced the pattern back to a single contaminated pump on Broad Street. The insight was not about air. It was about water: the invisible system that carried the pathogen from source to victim.
Joseph Bazalgette fixed the problem at scale. He did not clean the Thames. Instead he sought to build a parallel system underneath it. This became eighty-two miles of intercepting sewers that captured the waste before it reached the water supply. The engineering was invisible from the surface. Londoners still smelled the river. But they stopped dying.
It is July 2021. Arsenal hire Nicolas Jover as set piece coach. He has spent two years at Manchester City, where Pep Guardiola let him draft set piece routines with the freedom of a civil engineer working on a blank canvas. Now he lands in north London with a filing cabinet full of choreography.
In the six seasons before Jover, Arsenal scored 72 set-piece goals: 12.0 per season, 18.2% of their output. In the four full seasons since: 15.8 per season, 21.0%. This season, still incomplete, they have fifteen already: twelve from corners alone. Dead balls account for 28.8% of their goals. The pipes are flowing beautifully.
There is another change, harder to see from goal totals alone. With Jover, Arsenal's corners do not merely finish better. They generate better shots. Their set-piece xG rises from 9.0 per season before Jover to 16.0 with him. The floor lifts.
The improvement has a specific address. In Jover's first full season, 65% of Arsenal's corner deliveries targeted the six-yard box. By 2025/26 it is 86%, the highest rate in a decade of data. Jover did not merely improve corners. He redirected them.
Engineered corners
Corner shot quality by season: xG per corner shot for Arsenal and Man City. Markers show Jover’s move to City (2019/20) and Arsenal (2021/22). 2017/18 to 2025/26, Opta shot patterns.
These are not coincidences. They are appointments.
The pattern appears twice. When Thomas Frank left Brentford for Tottenham in the summer of 2025, the same experiment ran again, this time with a control group built in. At Brentford, Frank's corner conversion averaged 9.0% across four Premier League seasons. Under his replacement Mark Andrews, it collapsed to 4.4%. But Brentford's throw-in weapon, built around Myles Kayode's physical capability rather than a coaching system, survived intact: 47 shots in 2024/25 under Frank, 47 shots in 2025/26 under Andrews. The coaching system left with the coach. The individual capability stayed with the player. At Spurs, Frank's first season produced 24.5% corner conversion, more than double Brentford's four-season average under him. Different squad, same engineer. The system followed him, not the squad.
Construction timeline
Rolling 20-match set-piece conversion for Arsenal and Manchester City. Jover's arrivals and departures marked. Conversion rises; shot share stays flat.
Different pipes
Not all dead balls are corners. Share of set-piece xG by restart type (toggle to goals, and to shots against). 2025/26 Premier League, Opta shot patterns.
“Set piece” is a lump term, and lumps hide the pipes. In the league overall, corners still account for 58.4% of set-piece xG. But throw-ins are not trivia: they produce 17.7% of set-piece xG and 16.3% of set-piece goals.
The mix is not evenly shared. Brentford get 35.3% of their set-piece xG from throw-ins. Switch the chart to against and you see the other side of the story: Liverpool concede 35.7% of their set-piece goals from throw-ins alone.
Who drags the average?
Throw-ins are a minority of dead balls, but a few teams can overindex heavily on attack, defence, or both. Ranked by throw-in share of set-piece xG.
Brentford are the clearest example of the pattern. In 2024/25 they generated 47 throw-in shots worth 7.2 xG, around 0.153 xG per shot. This season the volume holds but the quality falls: 47 shots, 4.0 xG, 0.086 per shot. The positions are easier to block. The throw itself is still hard to stop.
Brentford's throw
Throw-in set pieces are one of the few dead-ball types that a club can scale quickly. Bars show throw-in shots; line shows xG per shot. 2021/22 to 2025/26, Opta shot patterns.
The contaminated water
It is 27 December 2025. Anfield. Liverpool host a side that has won twice all season. André's corner arrives on the money. Tolu Arokodare meets it. Alisson gets a hand to it, off-balance and falling backwards, palming it down. The ball loops up. Bueno pokes it over him into the net. It is the thirteenth set piece goal Liverpool have conceded this season.
Thirteen. Against an expected-goals figure of 5.7.
Weighed by minutes played, Liverpool have the tallest starting XI in the division. They have a defence, perhaps not the best in the land, but certainly fresh from winning a title. Their two full backs are different now, one by choice and another by indifference, but there is no meaningful change in height or heading ability. The two towering centre-halves remain. Yet they leak from set pieces like a mains pipe with a crack in it. Four of those thirteen goals have come from throw-ins alone.
Select Liverpool in the diagram below and compare their flows against the Premier League overall. These are set-piece shots conceded: where Arsenal's system channels attempts into low-danger positions and snuffs out second phases, Liverpool's defensive structure lets the water through. Across the league, fifty-four per cent of corner goals come from second-phase play: foot shots on loose balls, not headers on first deliveries. The majority of the revolution is chaos, and Liverpool's system lets the chaos in.
The residents of Soho in 1854 did not lack clean clothes or scrubbed floors. Their homes were perfumed. But the Broad Street pump was contaminated, and no amount of cologne prevented the cholera from passing through the water. Liverpool have all the perfume: the talent, the stature, the defensive record in open play. What they lack is the plumbing.
On 30 December 2025, Liverpool terminated the contract of Aaron Briggs, their dedicated set piece coach. They switched from majority outswingers to near-exclusively inswingers at corners. Since then they have scored eight set piece goals and conceded two. This looks like a fix. A 2025 meta-analysis of 466,637 corners found that delivery type (inswing versus outswing) predicts goal probability at odds ratio 0.99. The curl does not matter. What matters is whether the movement patterns have been drilled, whether the second ball has been planned for, whether the runners know where they are going. The delivery data suggests Liverpool are rebuilding the infrastructure, not just changing the colour of the pipes. Before Briggs was fired, 36% of their corner deliveries targeted the six-yard box. After: 71%. The central zone, the highest-value pipe, doubled from 22% to 49%. One corner goal became six.
Set-piece shots against
How set-piece shots conceded flow through a defence: source → phase → body part → outcome. Select a team to compare with the Premier League overall.
Attack and defence
Set-piece goals scored (right) vs conceded (left). Sorted by net (scored minus conceded).
The appointment letter
There is a simple reason the plumbing metaphor keeps returning: set pieces are one of the few phases in football where cause and effect can be engineered. They are rehearsable. They are repeatable. And when the engineer moves, the numbers can move with him.
That is what makes Jover such a clean thread to follow. At City in 2019-2021 the line rises. At Arsenal from 2021 onwards the floor lifts. This does not prove the entire league-wide spike is coaching investment. It shows what “set piece coach” can mean when it is real.
What makes this more than a case study is what followed. In 2021/22, three Premier League clubs had dedicated set piece coaches. Today that number is between ten and twelve, with two more currently hiring. Jover did not change football's corners. He demonstrated that corners could be changed. Conversion was engineerable, not merely random. The clubs that acted on that demonstration built pipes. The clubs that watched and waited are still arguing about the air.
The adoption curve
Every tactical edge in football follows the same arc: discovery, adoption, saturation, compression, obsolescence. Pressing followed it. Inverted full-backs are following it now.
Set pieces are somewhere in the middle of the cycle. Every Premier League club employs a specialist set piece coach, or claims to. Set-piece goal share sat under 20% as recently as 2023/24, before spiking to 27.2%. Corner conversion has oscillated between 8.3% and 11.3% across eleven seasons with no clear trend until this year. Whether the spike holds depends on how many clubs actually build the infrastructure, and how many just hire the job title.
What is clear is the gap. Some clubs have built systems that score from dead balls and suppress them at the other end. Others are still relying on height and hope. The water has found the pipes. Not every club has built them.
The mechanism of compression is already visible in the research. Across 466,637 corners, inswing and outswing delivery predicted goal probability at odds ratio 0.99. The curl is irrelevant. The engineering underneath — which zones pay, what happens in the second phase, which parts of the system can be copied and which cannot — is the subject of what follows.
The water table
Bazalgette's sewers did not merely redirect waste. They lowered the water table of London itself. The ground beneath the city dried. Foundations that had been wet for centuries became stable. The engineering changed not just the surface but the substrate.
Something similar is happening to English football. As open play becomes more congested and the enclosures tighten the available grass, set piece goals become structurally more important. They are the one phase of play where coaching can impose order on chaos, where choreography defeats improvisation, where the analyst in the video room matters more than the tallest centre-back on the pitch.
Forty-seven per cent of all dead ball goals this season came from situations with an expected goals value below 0.15, chances that well-organised defences should clear. Nearly half the revolution is not attacking ingenuity. It is defensive failure: second phases not cleared, runners not tracked, loose balls not secured. The clubs at the top of the net set piece table are not only generating high-xG corners on attack. They are refusing to let the ball stay in their own six-yard box. The infrastructure works at both ends. The absence of goals from it is the proof.
Height is the miasma. It smells right. It correlates with nothing. The real explanation is invisible from the surface: specialist coaching, rehearsed routines, second-phase planning, the deliberate engineering of high-value chances from low-risk situations. The clubs that have built those systems are scoring more and conceding less from set pieces. The clubs that have not are Liverpool, the tallest squad in the league, perfumed and drowning.
Methods
4,067 Premier League matches from 2015/16 to 2025/26. Shot context attribution from Opta event data via WhoScored. Full methodology, data sources, and chart notes: Methods and Data Sources.
Follow your club's set piece record in the myTeam app
Live scores, fixtures, and stats for every Premier League club.