Stories
Interactive data visualisations exploring English football. Updated regularly during the season, plus deep dives you can explore any time.
Updated regularly
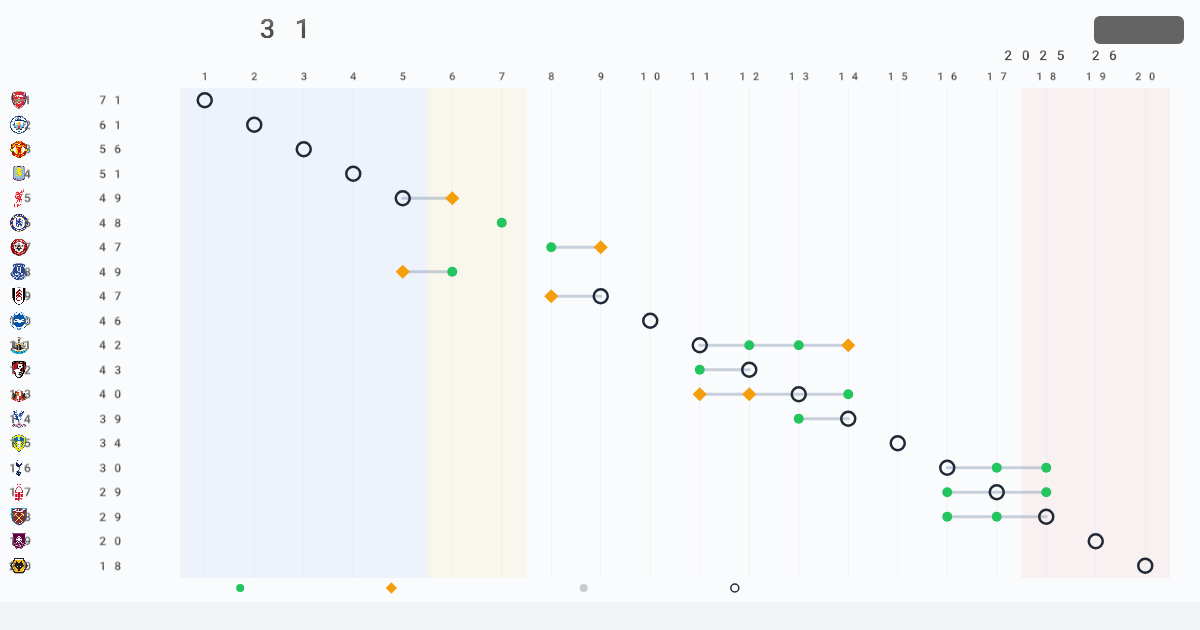
Table Possibilities
Every possible league position after this weekend — all 59,049 outcomes simulated.
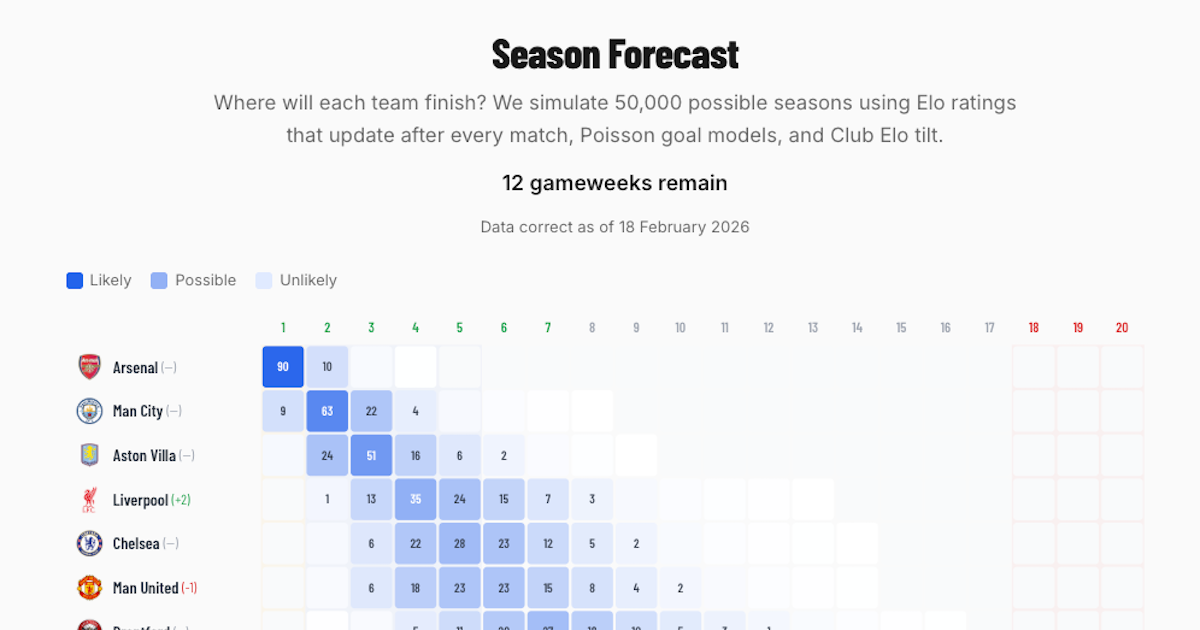
Season Forecast
Monte Carlo simulation of 50,000 seasons to predict where each team finishes.
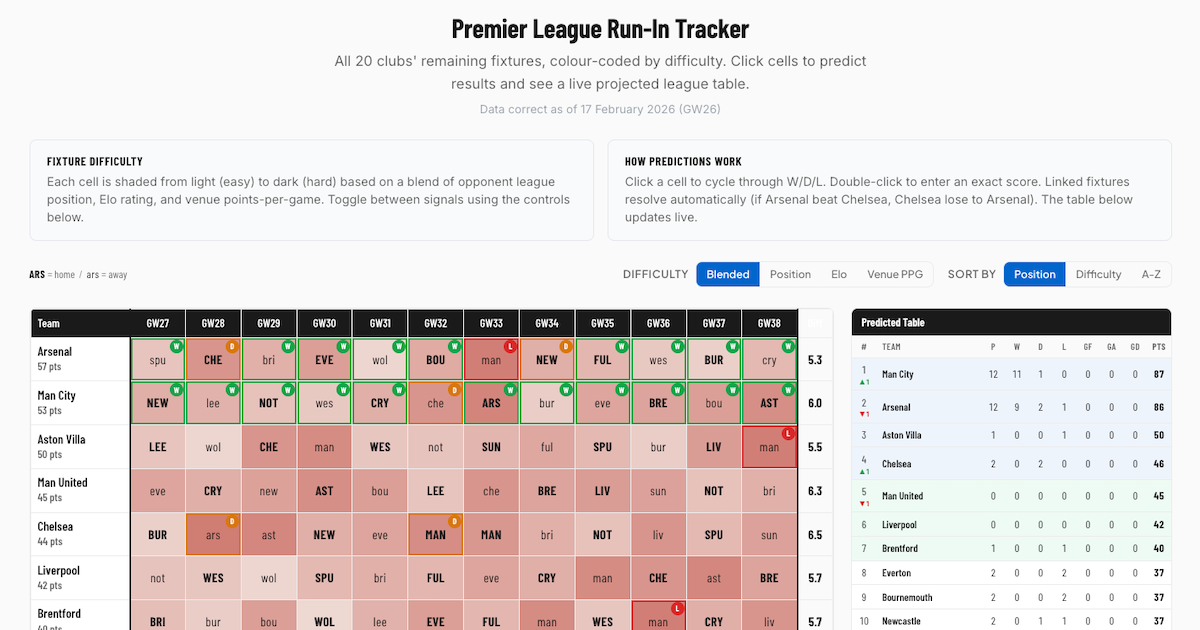
Run-In Tracker
Fixture grid colour-coded by difficulty. Predict results and see the projected table.
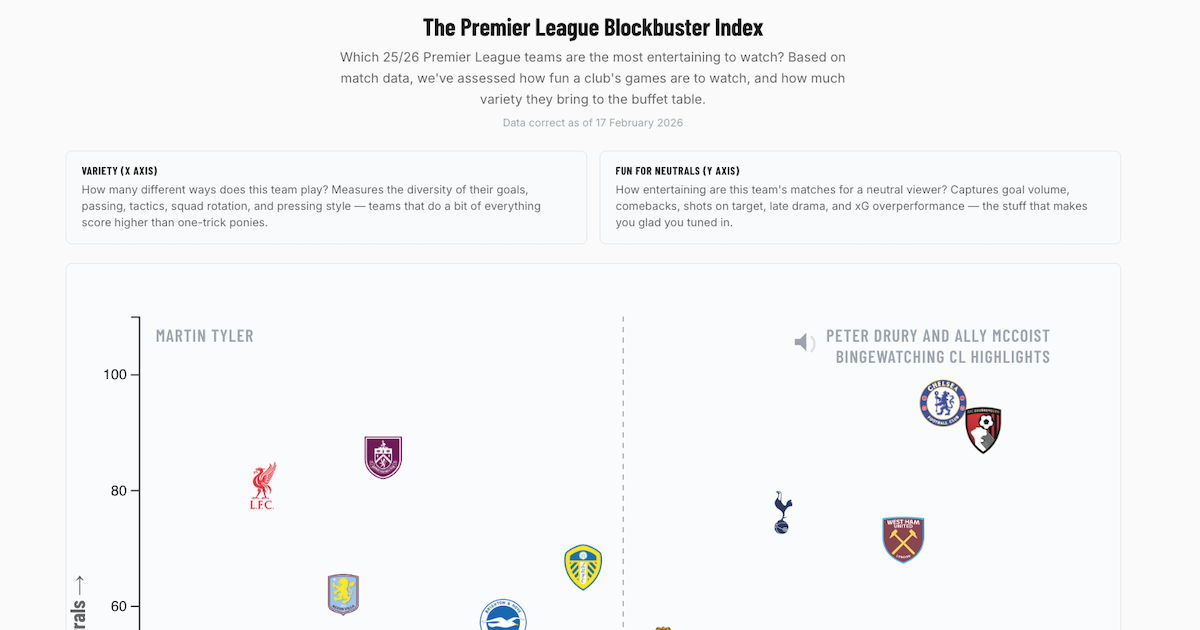
Blockbuster Index
Which clubs are the most entertaining? Variety vs Fun for Neutrals on an interactive scatter.
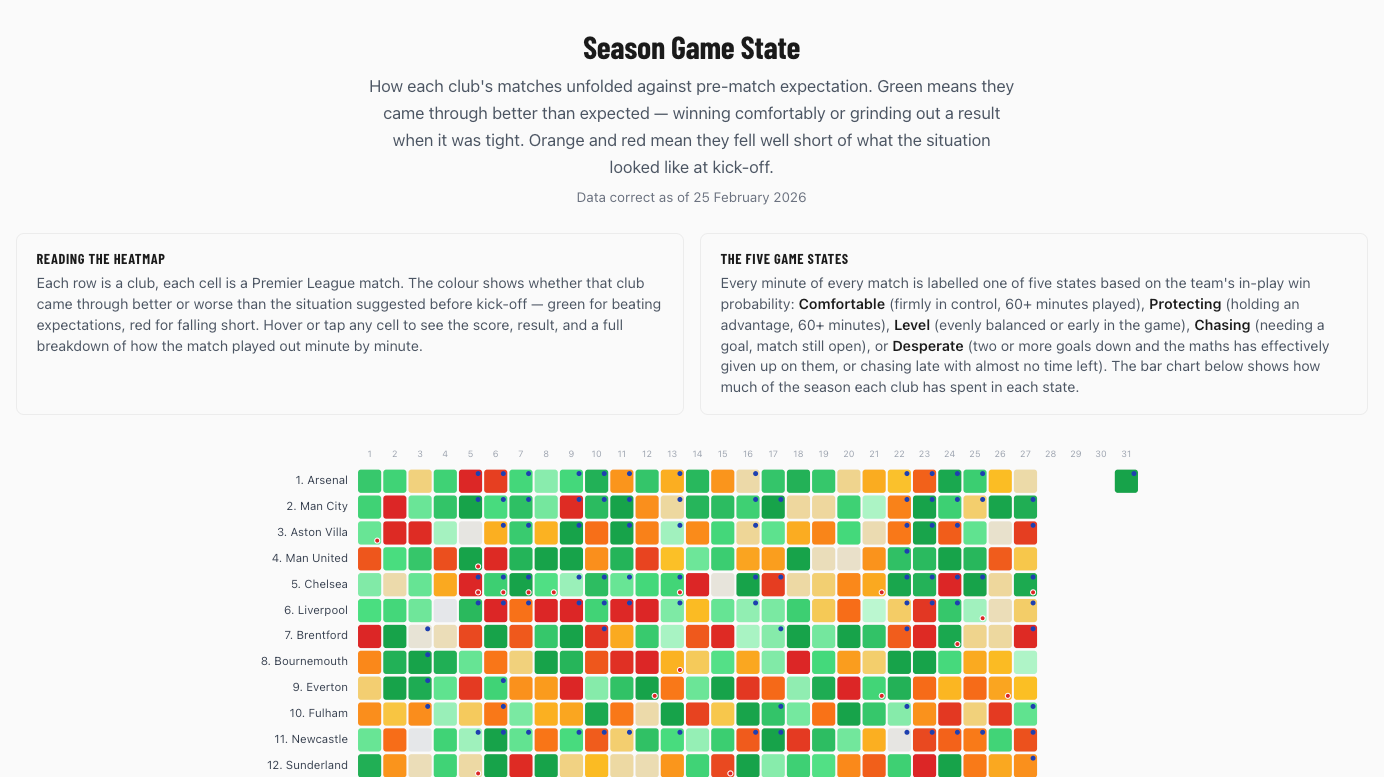
Season Game State
How each club performs when level, protecting, chasing, or desperate. Win probability heatmaps.
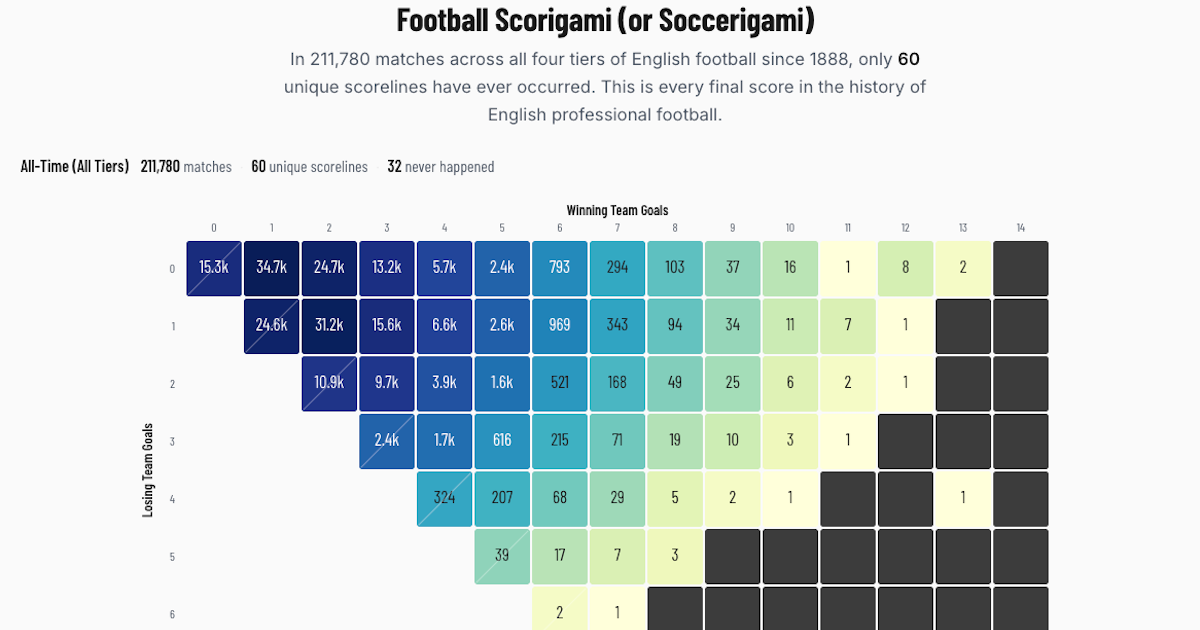
Scorigami
Every unique final score in 137 years of English professional football. 60 scorelines, and counting.
Explore
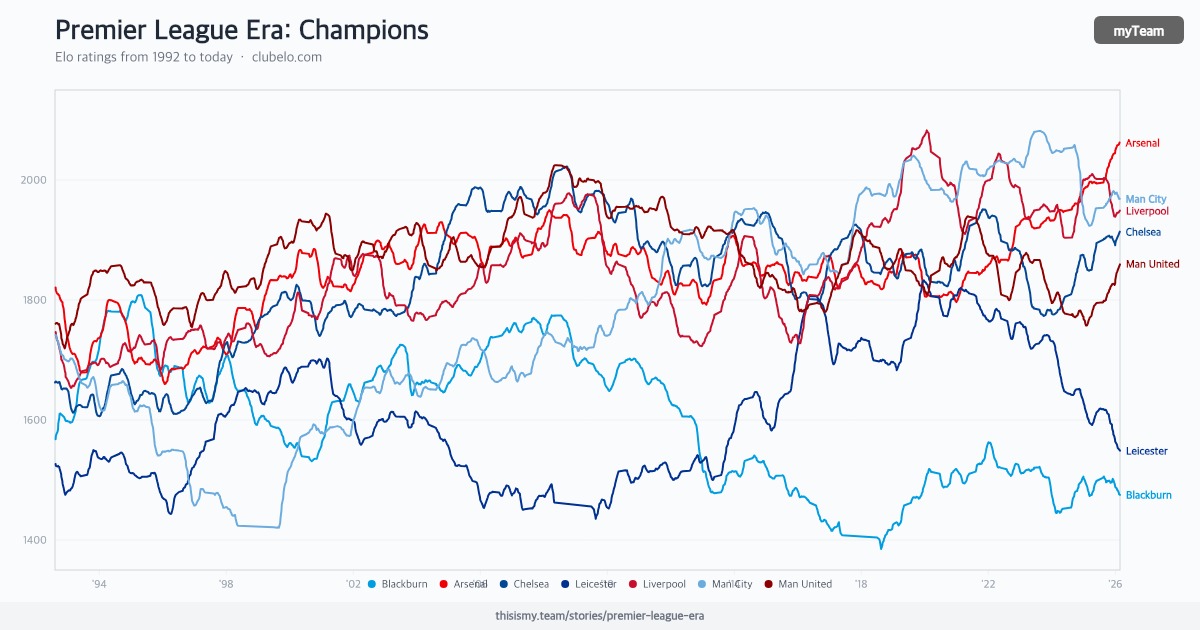
PL Era: Champions
30+ years of Elo history for every Premier League champion — rise and fall visualised.
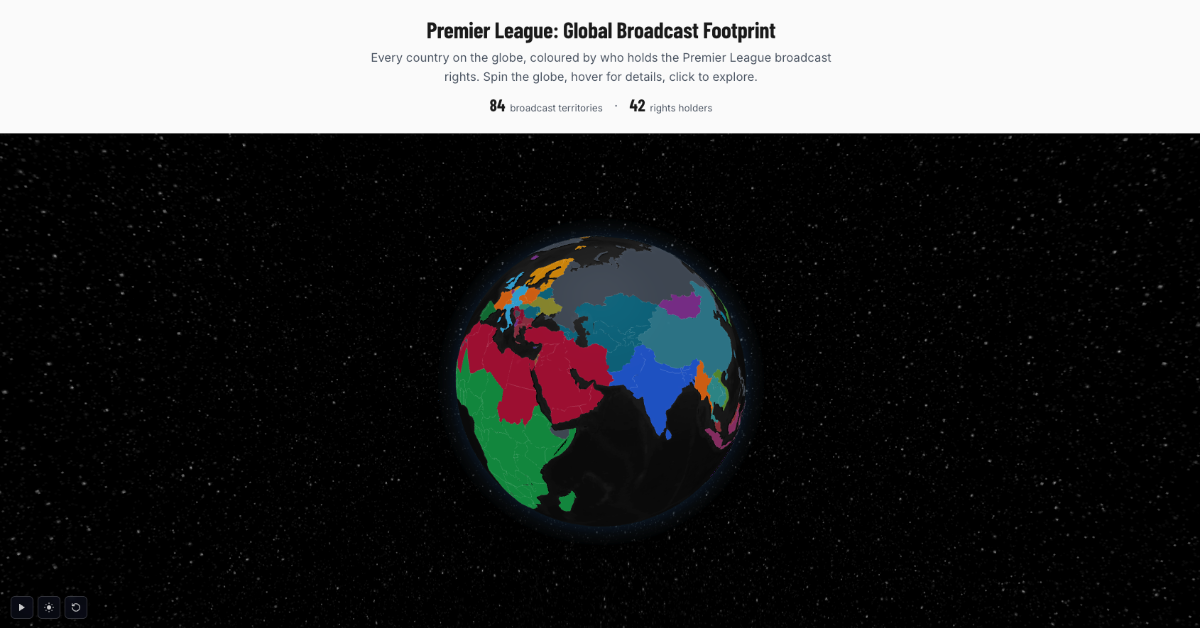
Global Broadcast Footprint
Every country on the globe, coloured by who holds the Premier League broadcast rights.
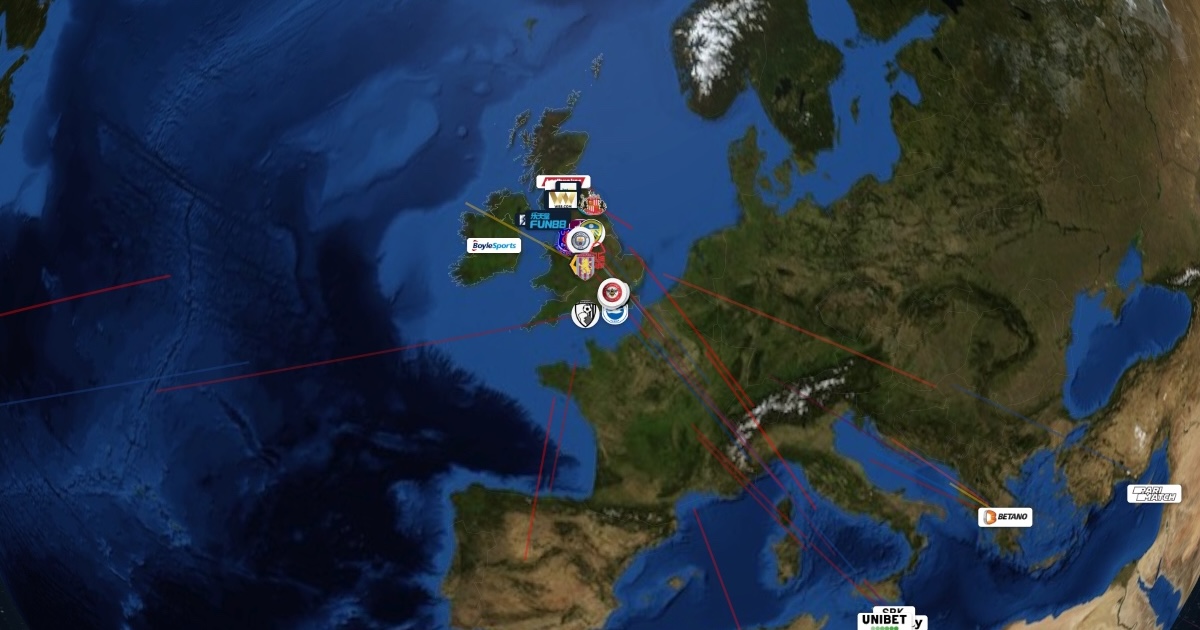
Betting Partners Map
Every Premier League club has at least one gambling sponsor. An interactive globe mapping them.
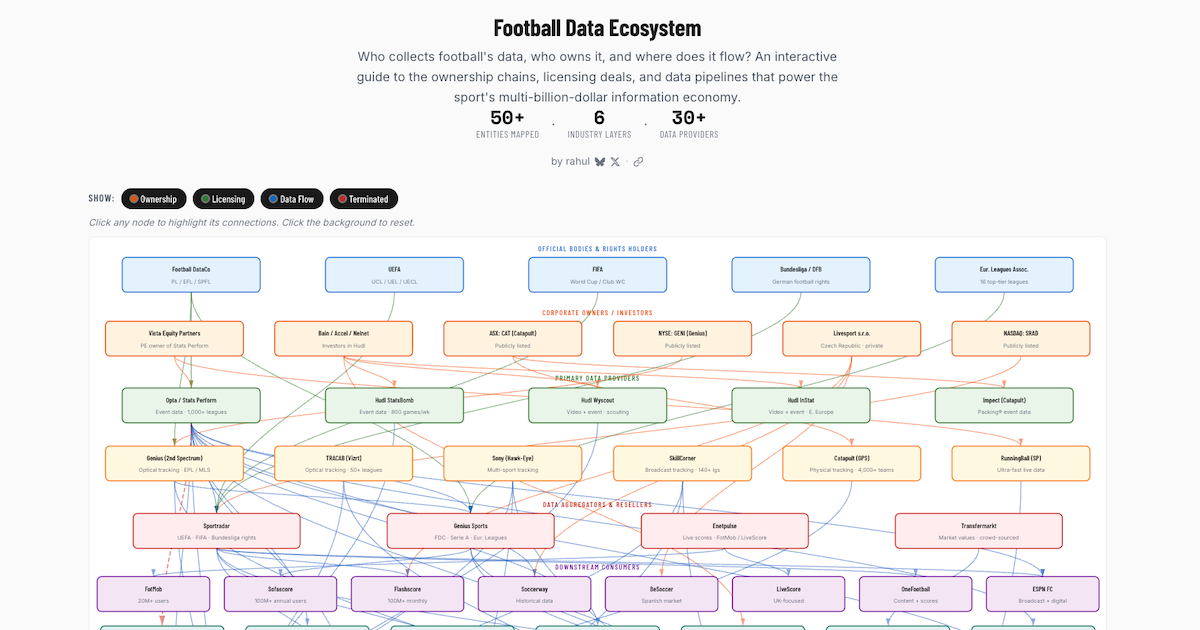
Football Data Ecosystem
Who collects football's data, who owns it, and where does it flow? An interactive network map.
By club
Season story and passing networks for every Premier League club.