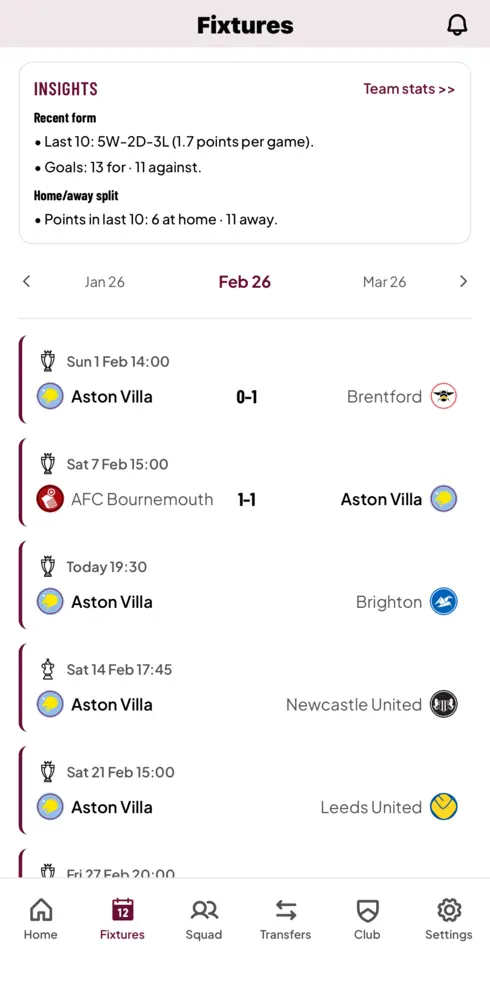
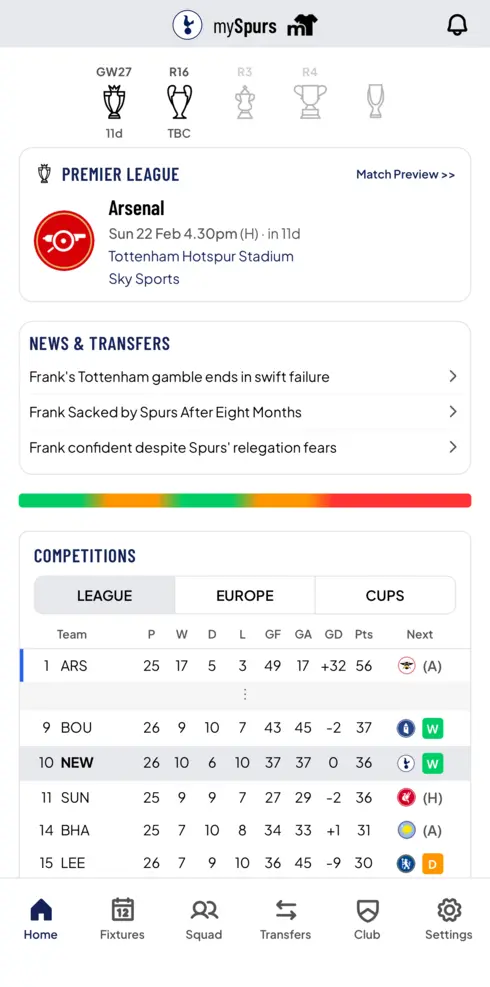
Track your club's run-in in the myTeam app
Live scores, remaining fixtures, and standings.
Premier League Run-In Tracker
All 20 clubs' remaining fixtures, colour-coded by difficulty. Click cells to predict results and see a live projected league table.
Data correct as of
Fixture Difficulty
Each cell is shaded from light (easy) to dark (hard) using Elo ratings by default. You can switch to league position or venue points-per-game using the controls below.
How Predictions Work
Tap a cell to cycle through W/D/L. Switch to Score mode for exact scores. Linked fixtures resolve automatically (if Arsenal beat Chelsea, Chelsea lose to Arsenal). The table below updates live.
Season Forecast
Hit Simulate to run 50,000 Monte Carlo seasons in your browser. Your predictions are locked in; the rest are sampled using hot Elo ratings. The heatmap shows each team's probability of finishing in each position. Full methodology →
Keyboard Shortcuts
- Arrow keys Navigate the fixture grid
- Enter or Space Predict the selected cell (W/D/L cycle or open score modal)
- Ctrl+Z / ⌘Z Undo last action
Methodology
- Difficulty is a weighted blend of three signals: league position (40%), Elo rating (35%), and venue-specific points-per-game (25%).
- Data from SportMonks (fixtures, standings) and ClubElo (Elo ratings). Updated weekly.
- Predictions are stored locally in your browser and encoded into the URL for sharing.
Track your club's run-in, fixtures and more in the myTeam app