Charts
Weekly data visualisations tracking the Premier League season.
League-wide
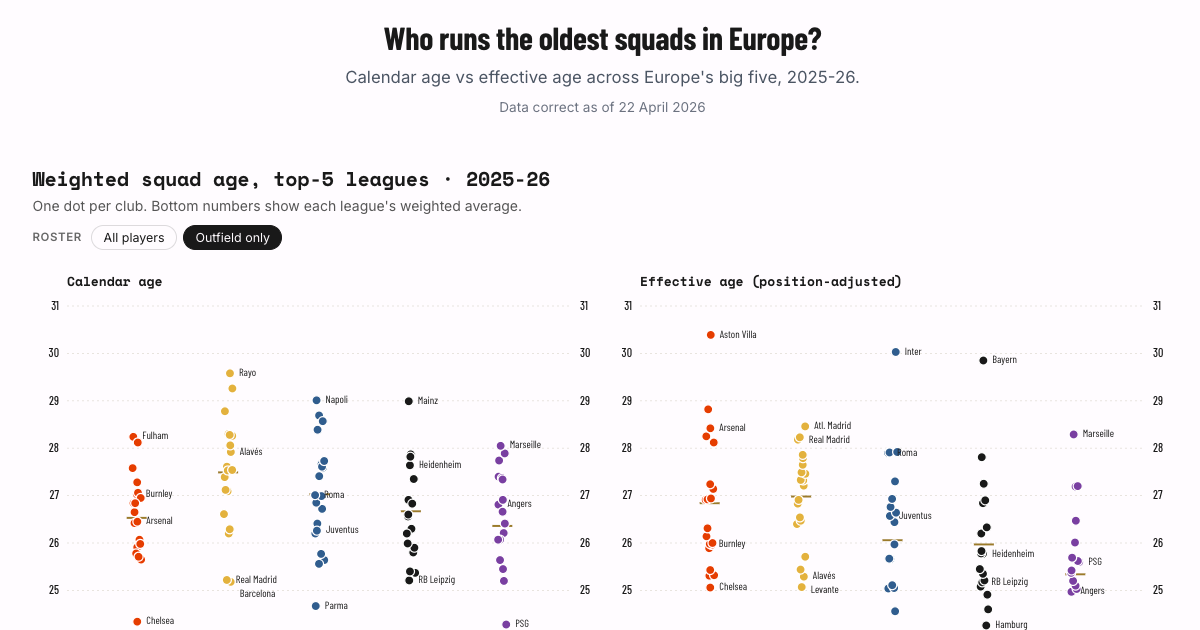
Squad Age · Europe
Calendar age vs effective age for every club across Europe's big five leagues. Three linked strip plots — who's oldest, who's carrying the most mileage, and where the Δs fall.
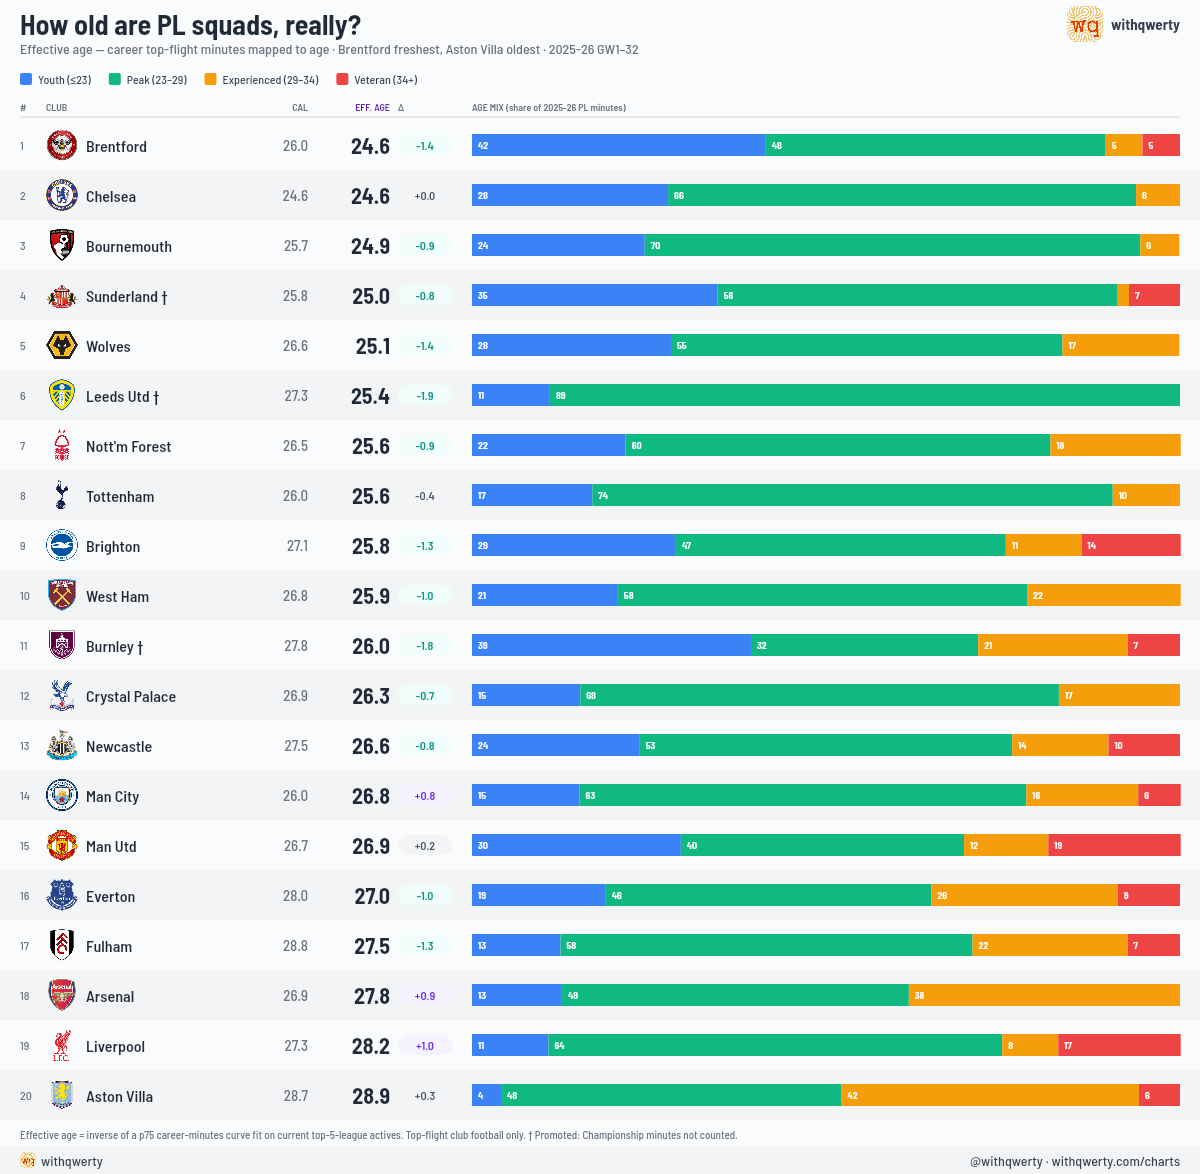
Squad Effective Age · PL
How old do PL squads really play? Effective age from career top-flight minutes, with interactive curve, goalkeeper and promoted-club toggles.
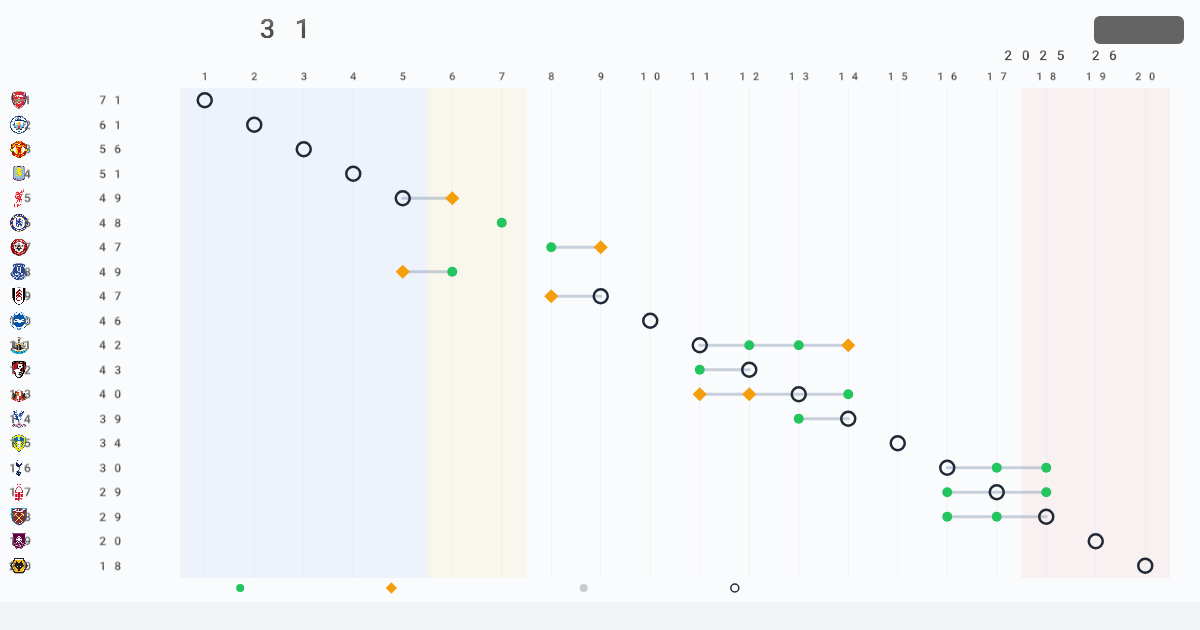
Table Possibilities
Where every club could still finish, gameweek by gameweek — up to 59,049 outcomes simulated.
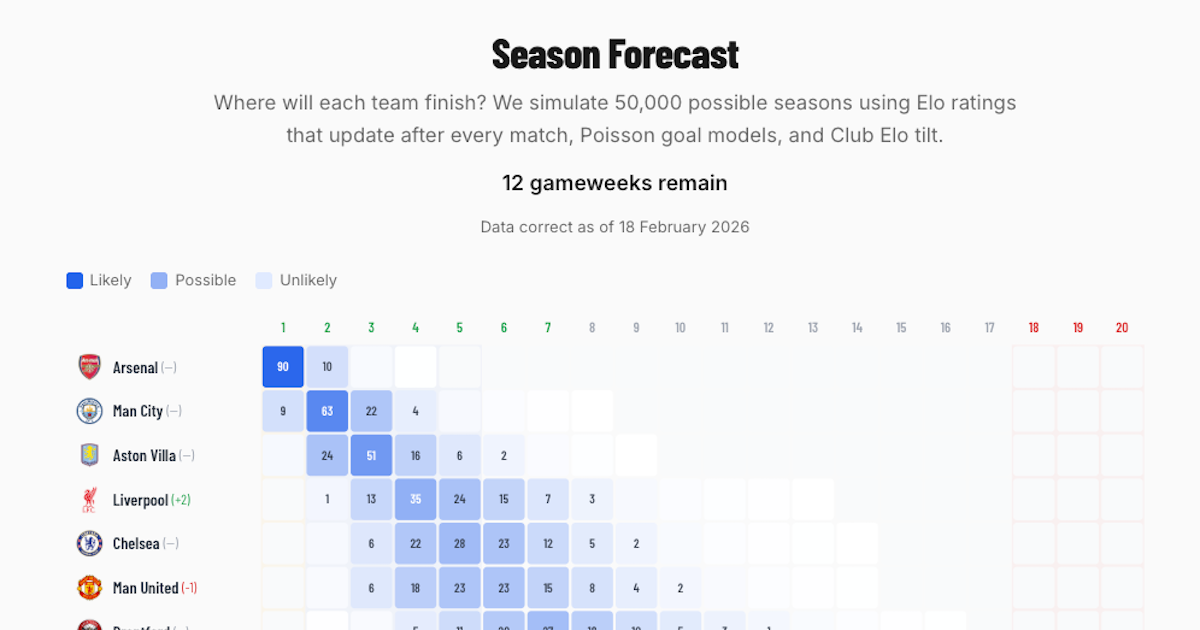
Season Forecast
Monte Carlo simulation of 50,000 seasons to predict where each team finishes.
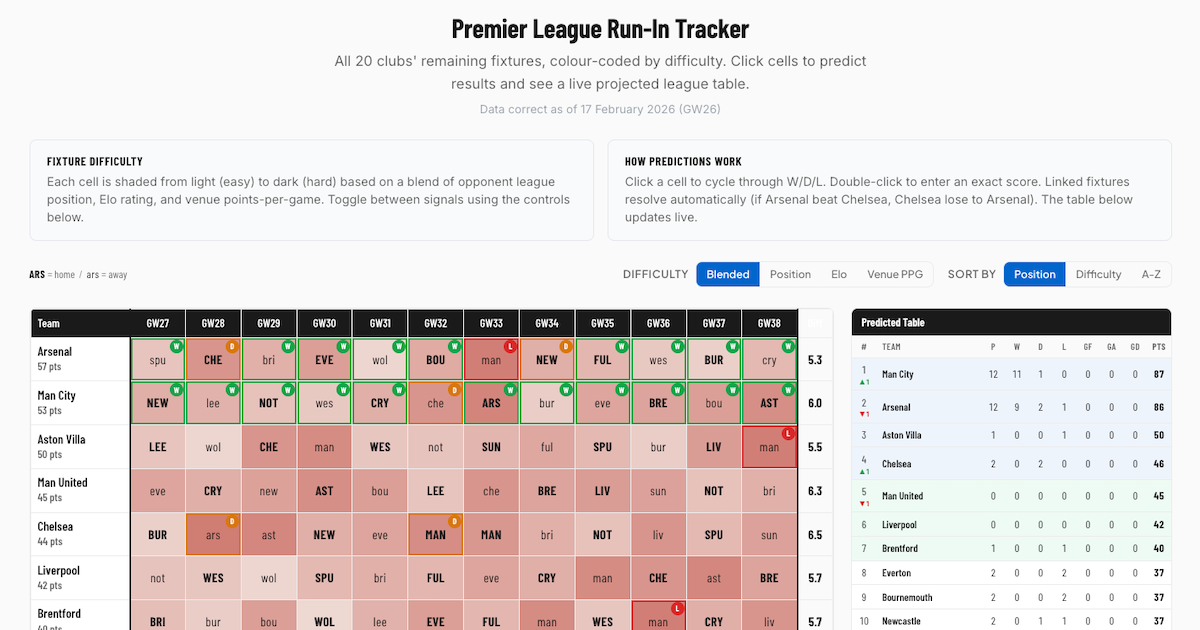
Run-In Tracker
Fixture grid colour-coded by difficulty. Predict results and see the projected table.
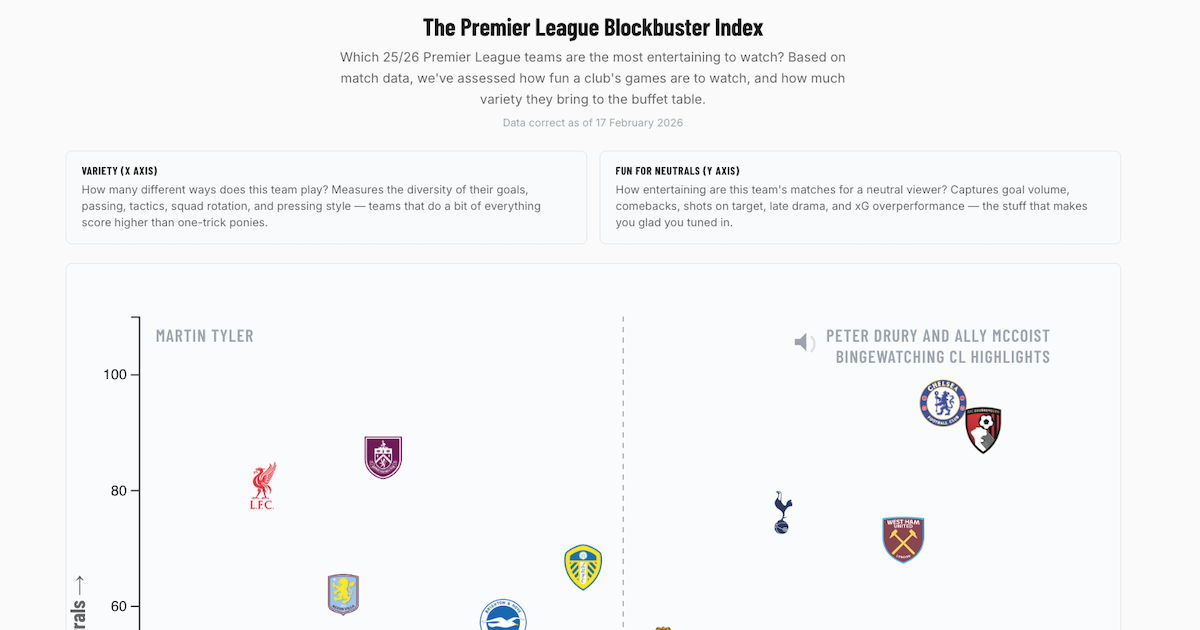
Blockbuster Index
Which clubs are the most entertaining? Variety vs Fun for Neutrals on an interactive scatter.
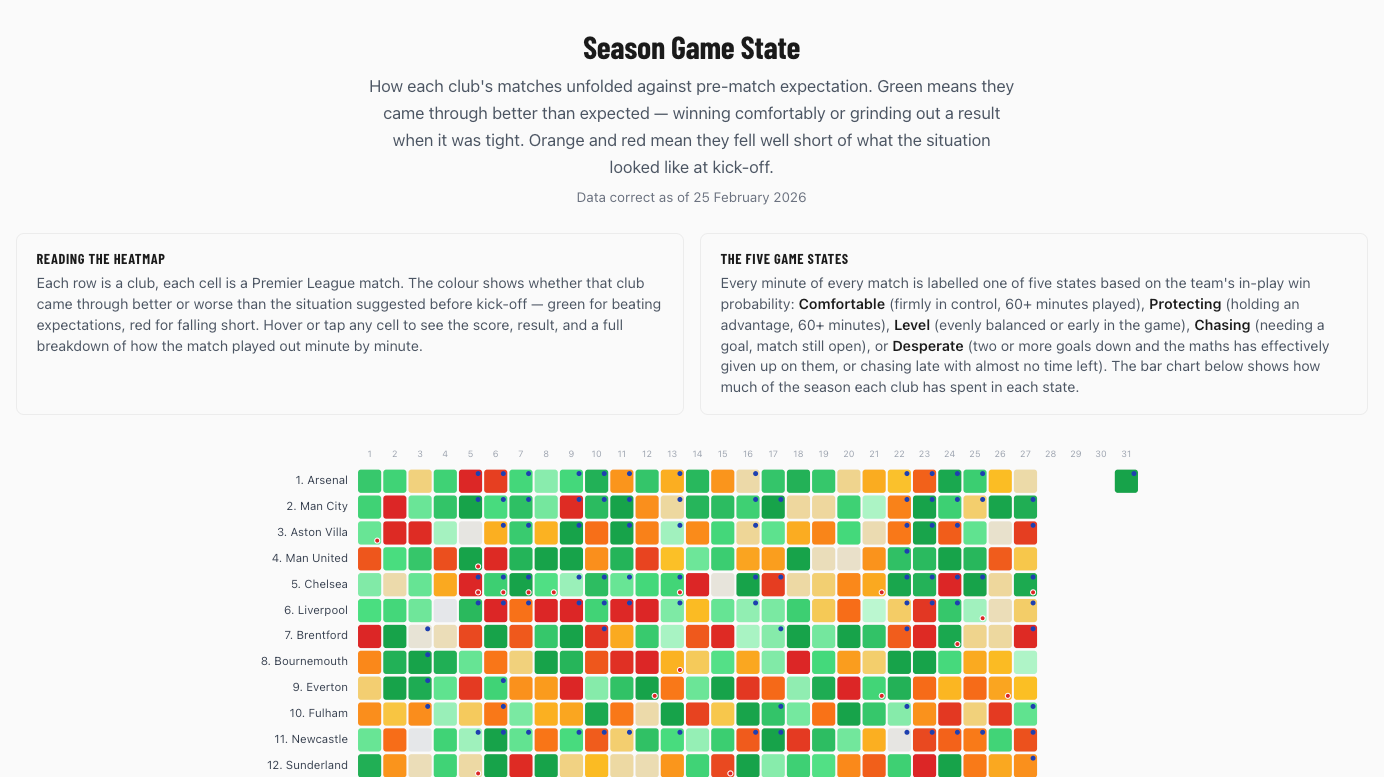
Season Game State
How each club performs when level, protecting, chasing, or desperate. Win probability heatmaps.
By club
Season story and passing networks for every Premier League club across 2025/26.