How old are PL squads, really?
Effective age: replacing birthdays with top-flight career minutes.
Data correct as of
Weighted calendar age is a clean way to rank Premier League squads. It's also misleading. A 24-year-old Bukayo Saka has already played more senior top-flight football than most 29-year-olds. Their birthdays look similar. Their football ages don't.
I redid the exercise with a different clock. Instead of counting years since birth, count career top-flight minutes, then map each player's minute total back to the age at which a typical top-5-league starter would be sitting on those minutes. Call it effective age.
The result: Brentford play the Premier League's freshest squad by football miles, Aston Villa the oldest. Calendar age gets a few of these close. The Δ column below shows where birthdays and football miles disagree by two years or more.
The ranking
Twenty Premier League squads, sorted by weighted effective age (youngest first). Each club's aggregate weights each player's effective age by their 2025-26 PL minutes played, so the chart captures who's actually on the pitch rather than who's registered.
| # | Club | Cal | Eff | Δ | +/− | Age mix by effective age |
|---|---|---|---|---|---|---|
| 1 |  Brentford Brentford | 26.1 | 25.3 | -0.8 | 5↑ / 1 / 10↓ | |
| 2 |  Chelsea Chelsea | 24.8 | 25.4 | +0.7 | 11↑ / 1 / 6↓ | |
| 3 |  Bournemouth Bournemouth | 25.8 | 25.6 | -0.2 | 6↑ / 7 / 5↓ | |
| 4 |  Sunderland † Sunderland † | 26.0 | 25.8 | -0.2 | 5↑ / 4 / 7↓ | |
| 5 |  Wolves Wolves | 26.6 | 25.9 | -0.7 | 3↑ / 5 / 10↓ | |
| 6 |  Leeds Utd † Leeds Utd † | 27.5 | 26.4 | -1.1 | 3↑ / 2 / 12↓ | |
| 7 |  Nott'm Forest Nott'm Forest | 26.7 | 26.4 | -0.3 | 3↑ / 7 / 6↓ | |
| 8 |  Brighton Brighton | 27.1 | 26.4 | -0.6 | 3↑ / 7 / 8↓ | |
| 9 |  Tottenham Tottenham | 26.1 | 26.4 | +0.3 | 7↑ / 10 / 3↓ | |
| 10 |  Burnley † Burnley † | 27.8 | 26.6 | -1.2 | 4↑ / 4 / 13↓ | |
| 11 |  West Ham West Ham | 26.9 | 26.7 | -0.2 | 7↑ / 2 / 10↓ | |
| 12 |  Crystal Palace Crystal Palace | 27.0 | 27.1 | +0.2 | 7↑ / 6 / 4↓ | |
| 13 |  Newcastle Newcastle | 27.5 | 27.4 | -0.1 | 7↑ / 5 / 9↓ | |
| 14 |  Man City Man City | 26.1 | 27.6 | +1.5 | 12↑ / 5 / 4↓ | |
| 15 |  Everton Everton | 28.1 | 27.8 | -0.3 | 5↑ / 1 / 8↓ | |
| 16 |  Man Utd Man Utd | 26.9 | 27.8 | +0.9 | 10↑ / 6 / 3↓ | |
| 17 |  Fulham Fulham | 28.9 | 28.4 | -0.5 | 4↑ / 4 / 13↓ | |
| 18 |  Arsenal Arsenal | 26.9 | 28.7 | +1.8 | 16↑ / 2 / 2↓ | |
| 19 |  Liverpool Liverpool | 27.4 | 29.2 | +1.8 | 13↑ / 0 / 4↓ | |
| 20 |  Aston Villa Aston Villa | 28.9 | 30.0 | +1.1 | 12↑ / 2 / 5↓ |
How to read the Δ column
Every row has two age numbers: Cal (weighted calendar age, i.e. birthdays) and Eff (weighted effective age, i.e. career mileage mapped to age). Δ is the gap between them. Under the default p75 curve, twelve of the twenty squads have at least half a year of disagreement between the two clocks; the rest sit closer to zero than you might expect.
- Δ positive (red): the squad plays like it's older than its birthdays suggest. Six clubs sit here under the default curve: Arsenal (+1.8), Liverpool (+1.8), Manchester City (+1.5), Aston Villa (+1.1), Manchester United (+0.9) and Chelsea (+0.7). Their starters broke through early and have been logging minutes ever since, so they carry more mileage than their ages imply.
- Δ negative (green): the squad plays fresher than its calendar age would suggest. Six clubs sit here: Burnley (−1.2), Leeds (−1.1), Brentford (−0.8), Wolves (−0.7), Brighton (−0.6) and Fulham (−0.5). Their senior players have shorter overall careers relative to their age, whether because they're late developers or because their path to the top flight took longer.
- Δ near zero (grey): calendar age and football mileage roughly agree. Eight squads sit in this band under the default p75 curve, from Tottenham (+0.3) down to Everton (−0.3). Toggle to the Median curve and the picture flips entirely: nineteen of the twenty squads read older than their birthdays, because against a median career path almost every Premier League regular is heavily run.
The +/− column next to Δ zooms in one level. For each club, it counts the regular starters (players with 900+ PL minutes this season) split by whether their individual effective age is at least half a year older (↑), on (=), or younger (↓) than their calendar age. Arsenal reads 16↑ / 2 / 2↓, Liverpool 13↑ / 0 / 4↓: almost all their regulars play older than their birthdays. At the opposite end, Burnley reads 4↑ / 4 / 13↓, a squad mostly made of fresh top-flight careers.
About the toggles
Curve. The effective-age mapping depends on where you draw the reference line through the career-minutes-vs-age cloud. p75 is the default (a typical developed starter's trajectory). The Median button shows what happens with the true middle of the distribution, which puts more squads on the older end since most PL starters sit above the median of their age cohort. The toggle lets you see how much the ranking depends on that editorial choice.
Goalkeepers. Keepers accumulate minutes faster than outfielders because they play full 90s and rarely rotate. With a single mixed-position curve (the approach here), that pushes keepers toward higher effective ages, which rolls up into their club's aggregate. Switching to "Outfielders only" strips that bias out.
In practice goalkeepers are around 9% of every club's PL minutes, so the removal shifts rankings modestly (never by more than four positions). The clearest movers are clubs with a mileage-heavy starter keeper (Leno at Fulham, Sá at Wolves, Pickford at Everton, all make the squad look younger without them) or a low-mileage one (Verbruggen at Brighton, who makes the squad look slightly older without him). Wolves and Burnley are the biggest risers, each climbing four places once their keeper is excluded.
Promoted clubs. Leeds, Burnley and Sunderland (marked with †) joined this Premier League season after winning the 2024-25 Championship. Their squads were assembled at a different tier and they've had one window to reshape for top-flight competition. Toggle them out if you want a like-for-like view of the 17 sides that have built across multiple PL seasons.
Methodology
The reference curve
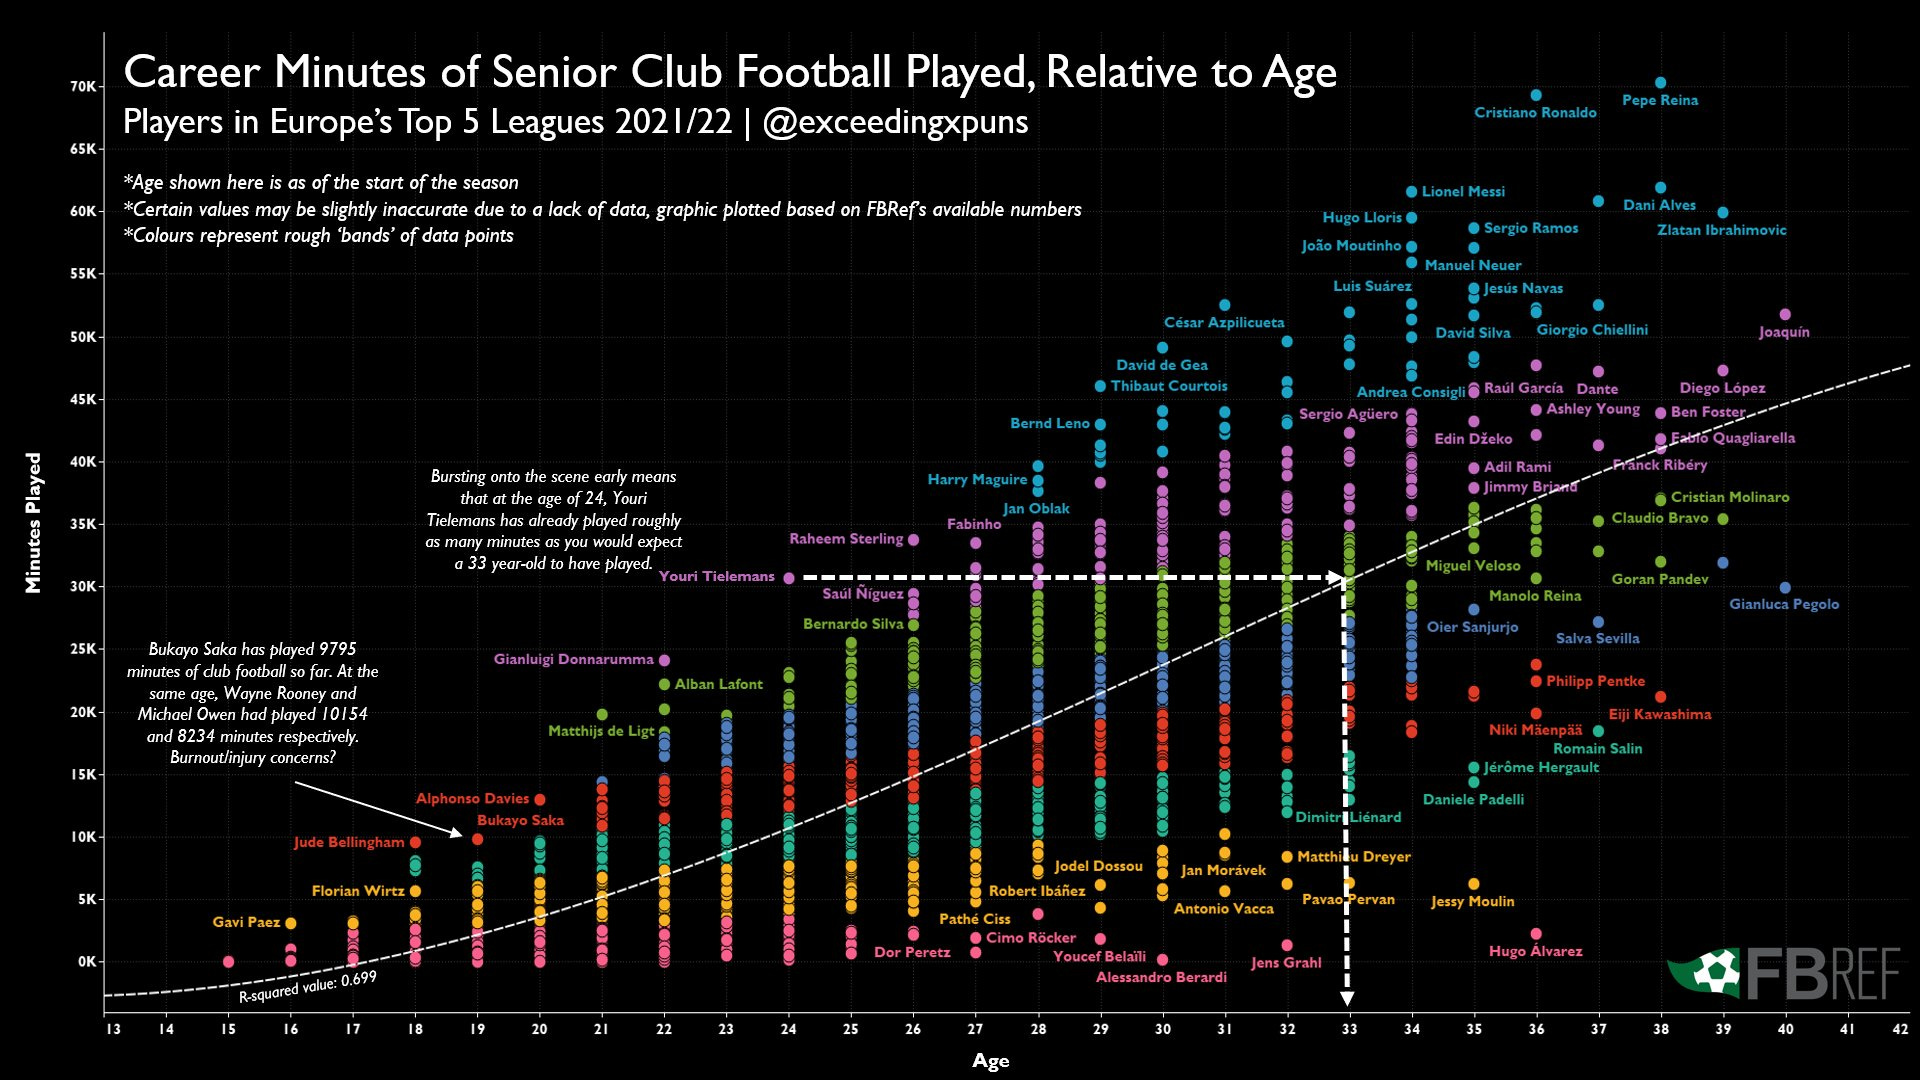
The idea that career minutes are a better proxy for wear than birthdays isn't new. The clearest published version is this chart by @exceedingxpuns, using FBRef data. Every top-5-league player in 2021/22 is plotted by age against cumulative senior minutes, with a trend line through the cloud.
Fitting the curve
The reference population is 2,335 current top-5-league actives with at least 500 career senior-club minutes. For each single-year age bucket I took the 75th percentile of career minutes (roughly a typical developed starter at that age), then fit a cubic through those anchor points. The curve is fit separately per position bucket, so wingers are measured against a winger trajectory and centre-backs against a centre-back one; the global curve shown here is the population-wide reference.
The choice of p75 rather than the mean is deliberate. The mean is pulled down by rotation players and benchwarmers. The FBRef reference above (which annotates Tielemans at 24 as having "the minutes of a 33-year-old") is effectively a p75 trajectory, so sitting on the same curve matches the mental model the reader already has.
This is the top-5-league fit — the full roster of current actives across Premier League, La Liga, Serie A, Bundesliga and Ligue 1, split by position. See the cross-league view for how the same numbers compare across the big five.
The fit range tops out at age 34.5 (the last age bucket with 15+ players in the sample). Beyond that the curve is a polynomial extrapolation, not a measurement. The values are still shown for specific players (e.g. Salah 37, Bruno 36) because they're useful context, but they appear in the popover with a dotted underline to flag that they're the polynomial's guess at a zone with thin reference data. Under the position-aware default curve, the extrapolation affects elite veterans in the striker and winger buckets most — those buckets' curves top out earlier than the centre-back one, so a high-mileage 30+ striker tips into polynomial territory sooner than an equally-miled centre-back would.
Checkpoint values from the fitted curve:
- age 192,144 min
- age 2310,160 min
- age 2617,116 min
- age 2924,883 min
- age 3336,505 min
- age 3646,175 min
- age 4060,345 min
What counts as a minute
In scope: senior club football of every tier. League minutes in any first, second, third or fourth division worldwide (Premier League, Championship, League One, League Two, and their equivalents across roughly 30 covered countries), domestic cups (FA Cup, Copa del Rey, DFB-Pokal and equivalents), league cups (EFL Cup and equivalents), domestic super cups, league trophies (EFL Trophy), and all senior continental competitions (Champions League, Europa League, Conference League, plus qualifying rounds).
Out of scope: youth leagues (Premier League 2, U18 Premier League, UEFA Youth League, FA Youth Cup), reserve-team competitions, friendlies, and all national-team matches (Euros, World Cup, Nations League, qualifiers). Career minutes are collected from Transfermarkt and aggregated across those scopes; per-game records go back beyond 2005 for most players, so pre-2012 careers are captured in full. Rosters, dates of birth and 2025-26 PL minutes come from the dcaribou Transfermarkt dataset.
Known limitations
- Survivorship bias in the curve. The fit sample is current top-5-league actives. They got there by being good enough to still be playing at that level, so the curve reflects successful senior careers rather than the full population of professional footballers. For comparing PL clubs to each other this is fine. For absolute claims ("Saka has played 5 years more football than average") it's slightly overstating.
- Position-adjusted as of April 2026. This page now fits separate career-minutes-vs-age curves per position bucket (GK/CB/FB/CM/AM/WM/ST), following Michael Caley's age-curve work. Strikers and wingers accumulate minutes more slowly than centre-backs, so a single mixed curve silently inflated CB-heavy squads and flattered striker-heavy ones. The Goalkeepers · Outfielders only toggle remains useful for GK-only views since the GK sample is still too thin to support its own curve and falls back to the overall one.
- Promoted clubs are new to the division. Leeds, Burnley and Sunderland (†) were assembled for a different tier and had one window to reshape. Their Championship minutes count as senior career wear in the aggregate, putting them on the same scale as everyone else. The squad they're fielding still has less PL-era construction behind it, though. The Promoted clubs · Exclude toggle restricts the ranking to the 17 longer-tenured sides.